This article is a brief description of what you can find on your homepage.
When you first log on to the Impact Atlas web browser, you will see the following screen:

The cohort name will be on the top with the number of active participants, months of the program, and any needs attention items immediately visible in the colored blocks. It is important to notice the cohort you are viewing as the homepage data is going to exclusively show data for that cohort. If want to see data from another cohort, you can change it by clicking the down arrow next to the cohort name as shown below. This article explains in greater detail how to switch between cohorts.

Below these colored blocks, you will have your overall indicator progress as well as the tracking status for your program as shown below:

Your overall indicator status might not be immediately visible because you might not have started filling out surveys that are linked to those indicators. If you still have questions regarding that, please reach out to support.
The tracking status widget shows a dynamic chart that tracks the status of your program through trainings and surveys that are completed on the platform. For more information on this widget, please see this article.
Using the top navigation panel, you can view program demographics, evaluations, and photos in greater detail. Simply click on any of those options to view graphics that illustrate the data you have collected during the program in those categories.
For example, the demographics widget is shown below:
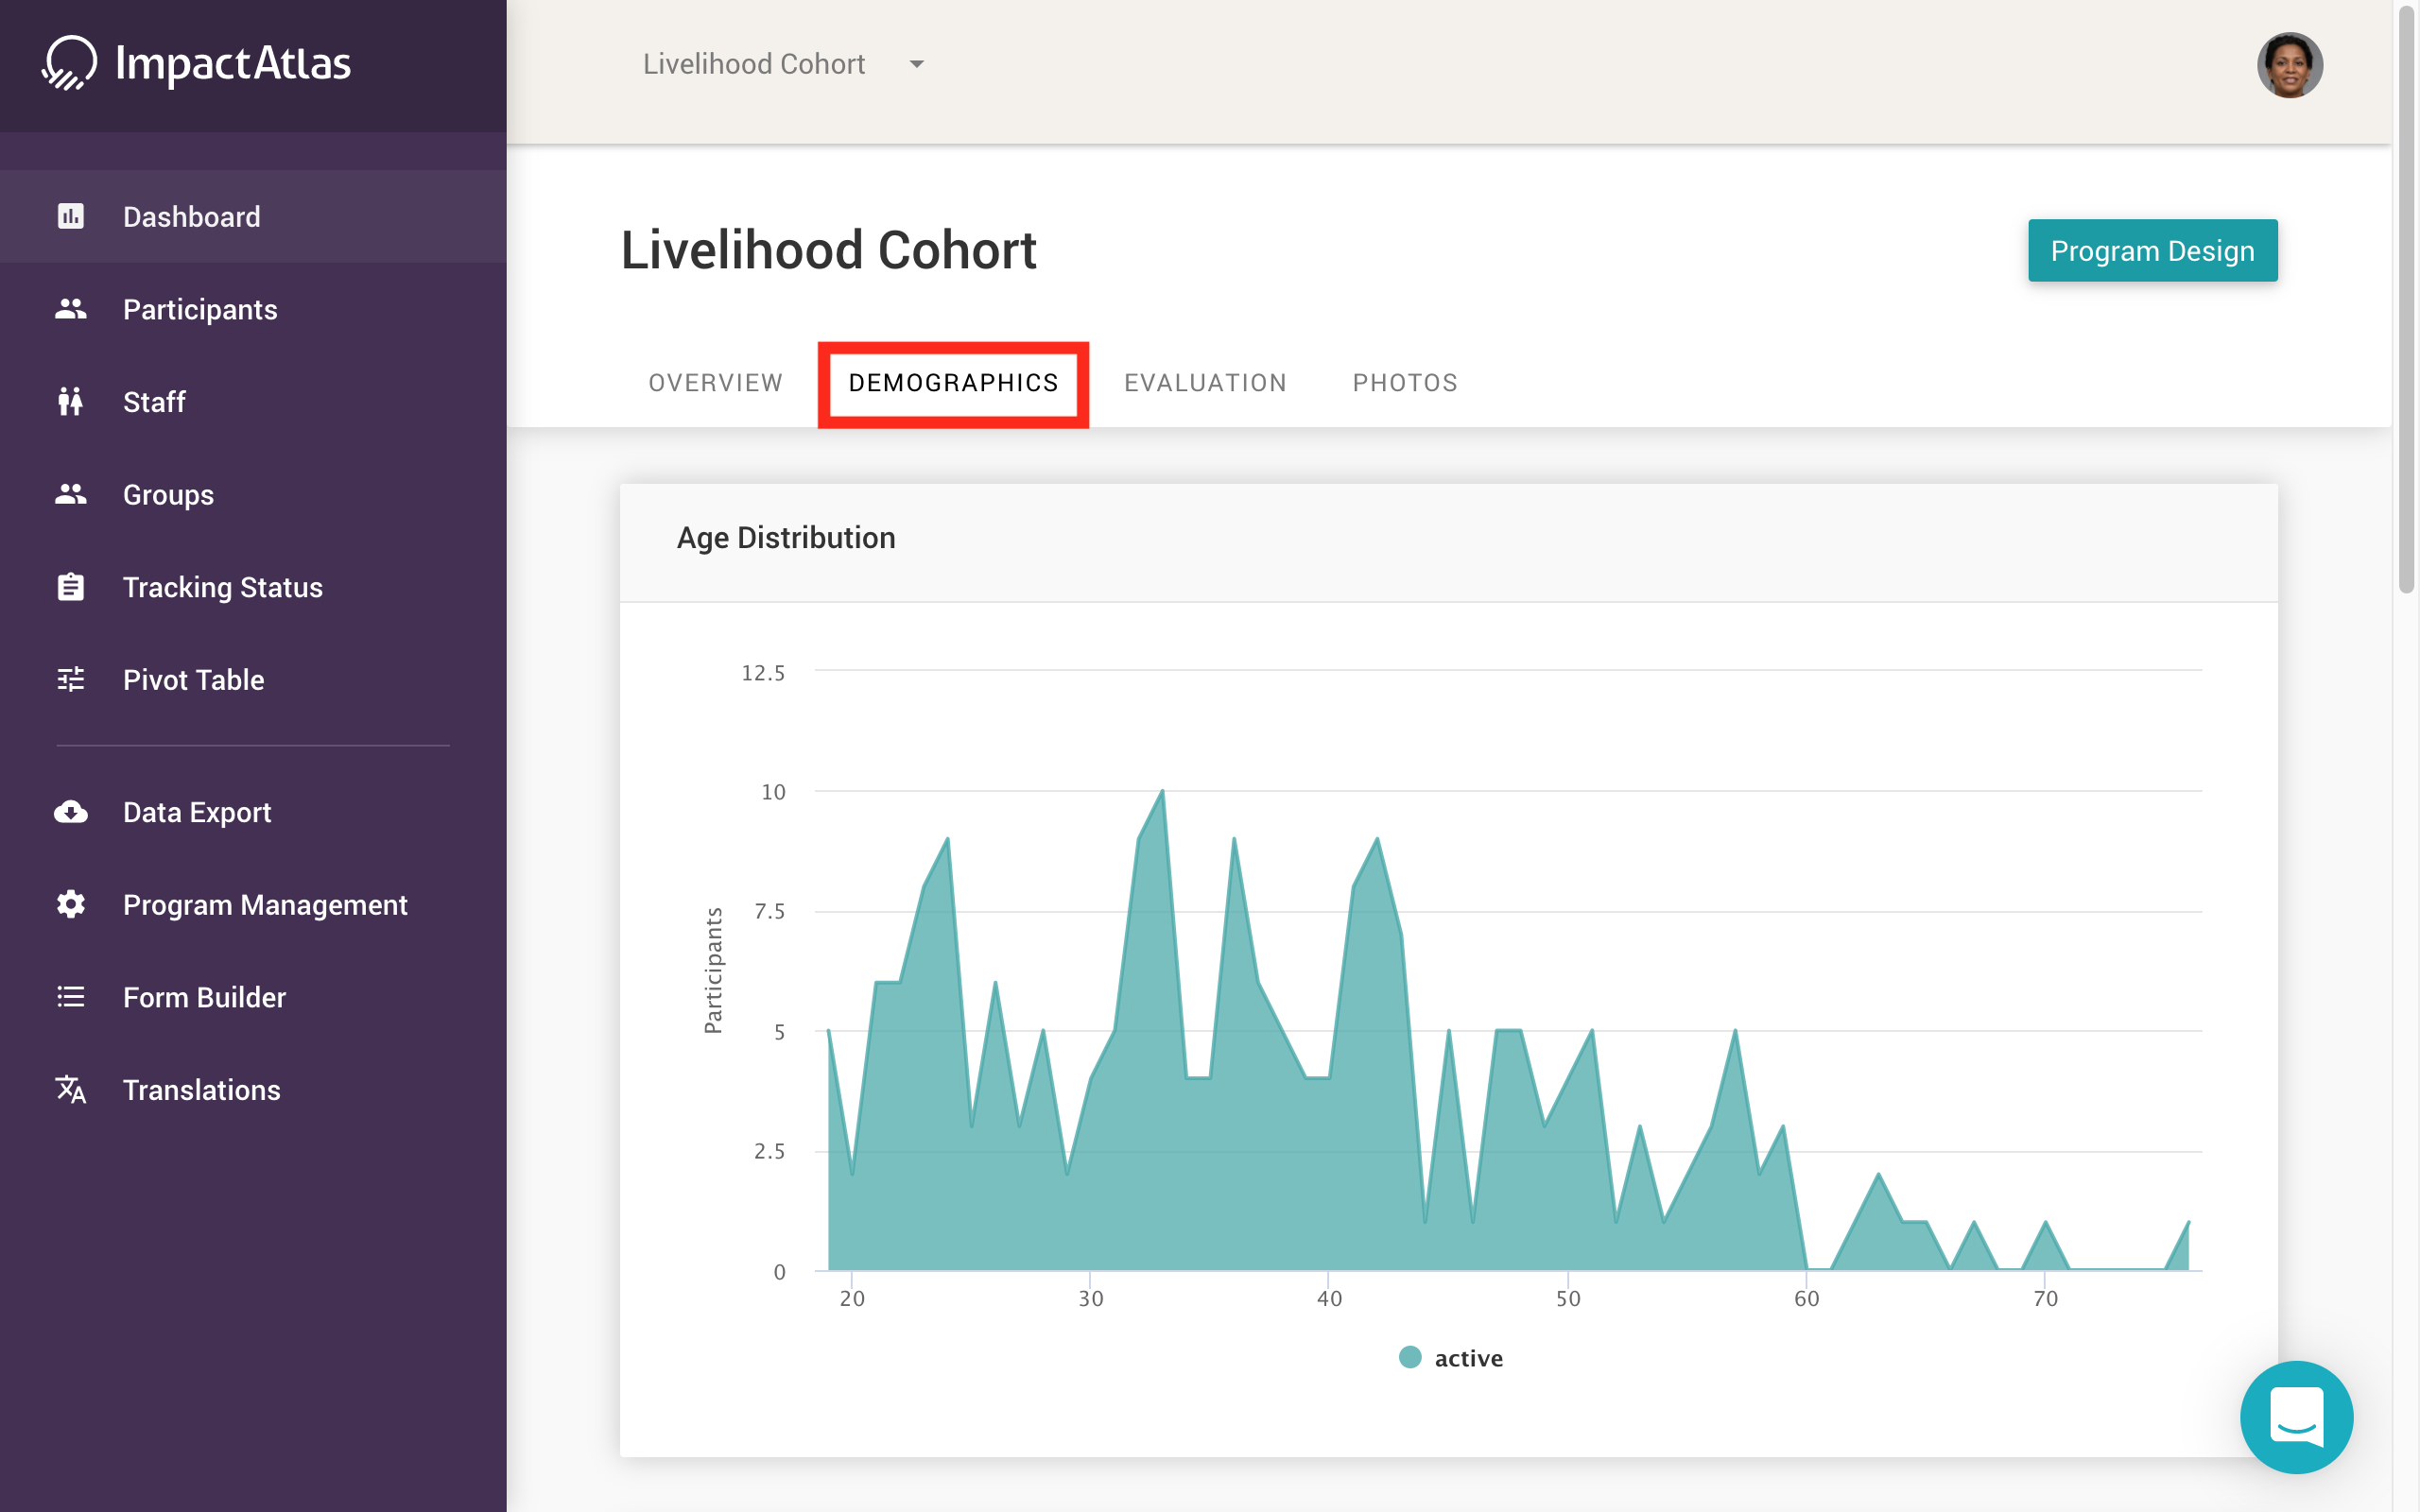.png)
And the evaluation widget:
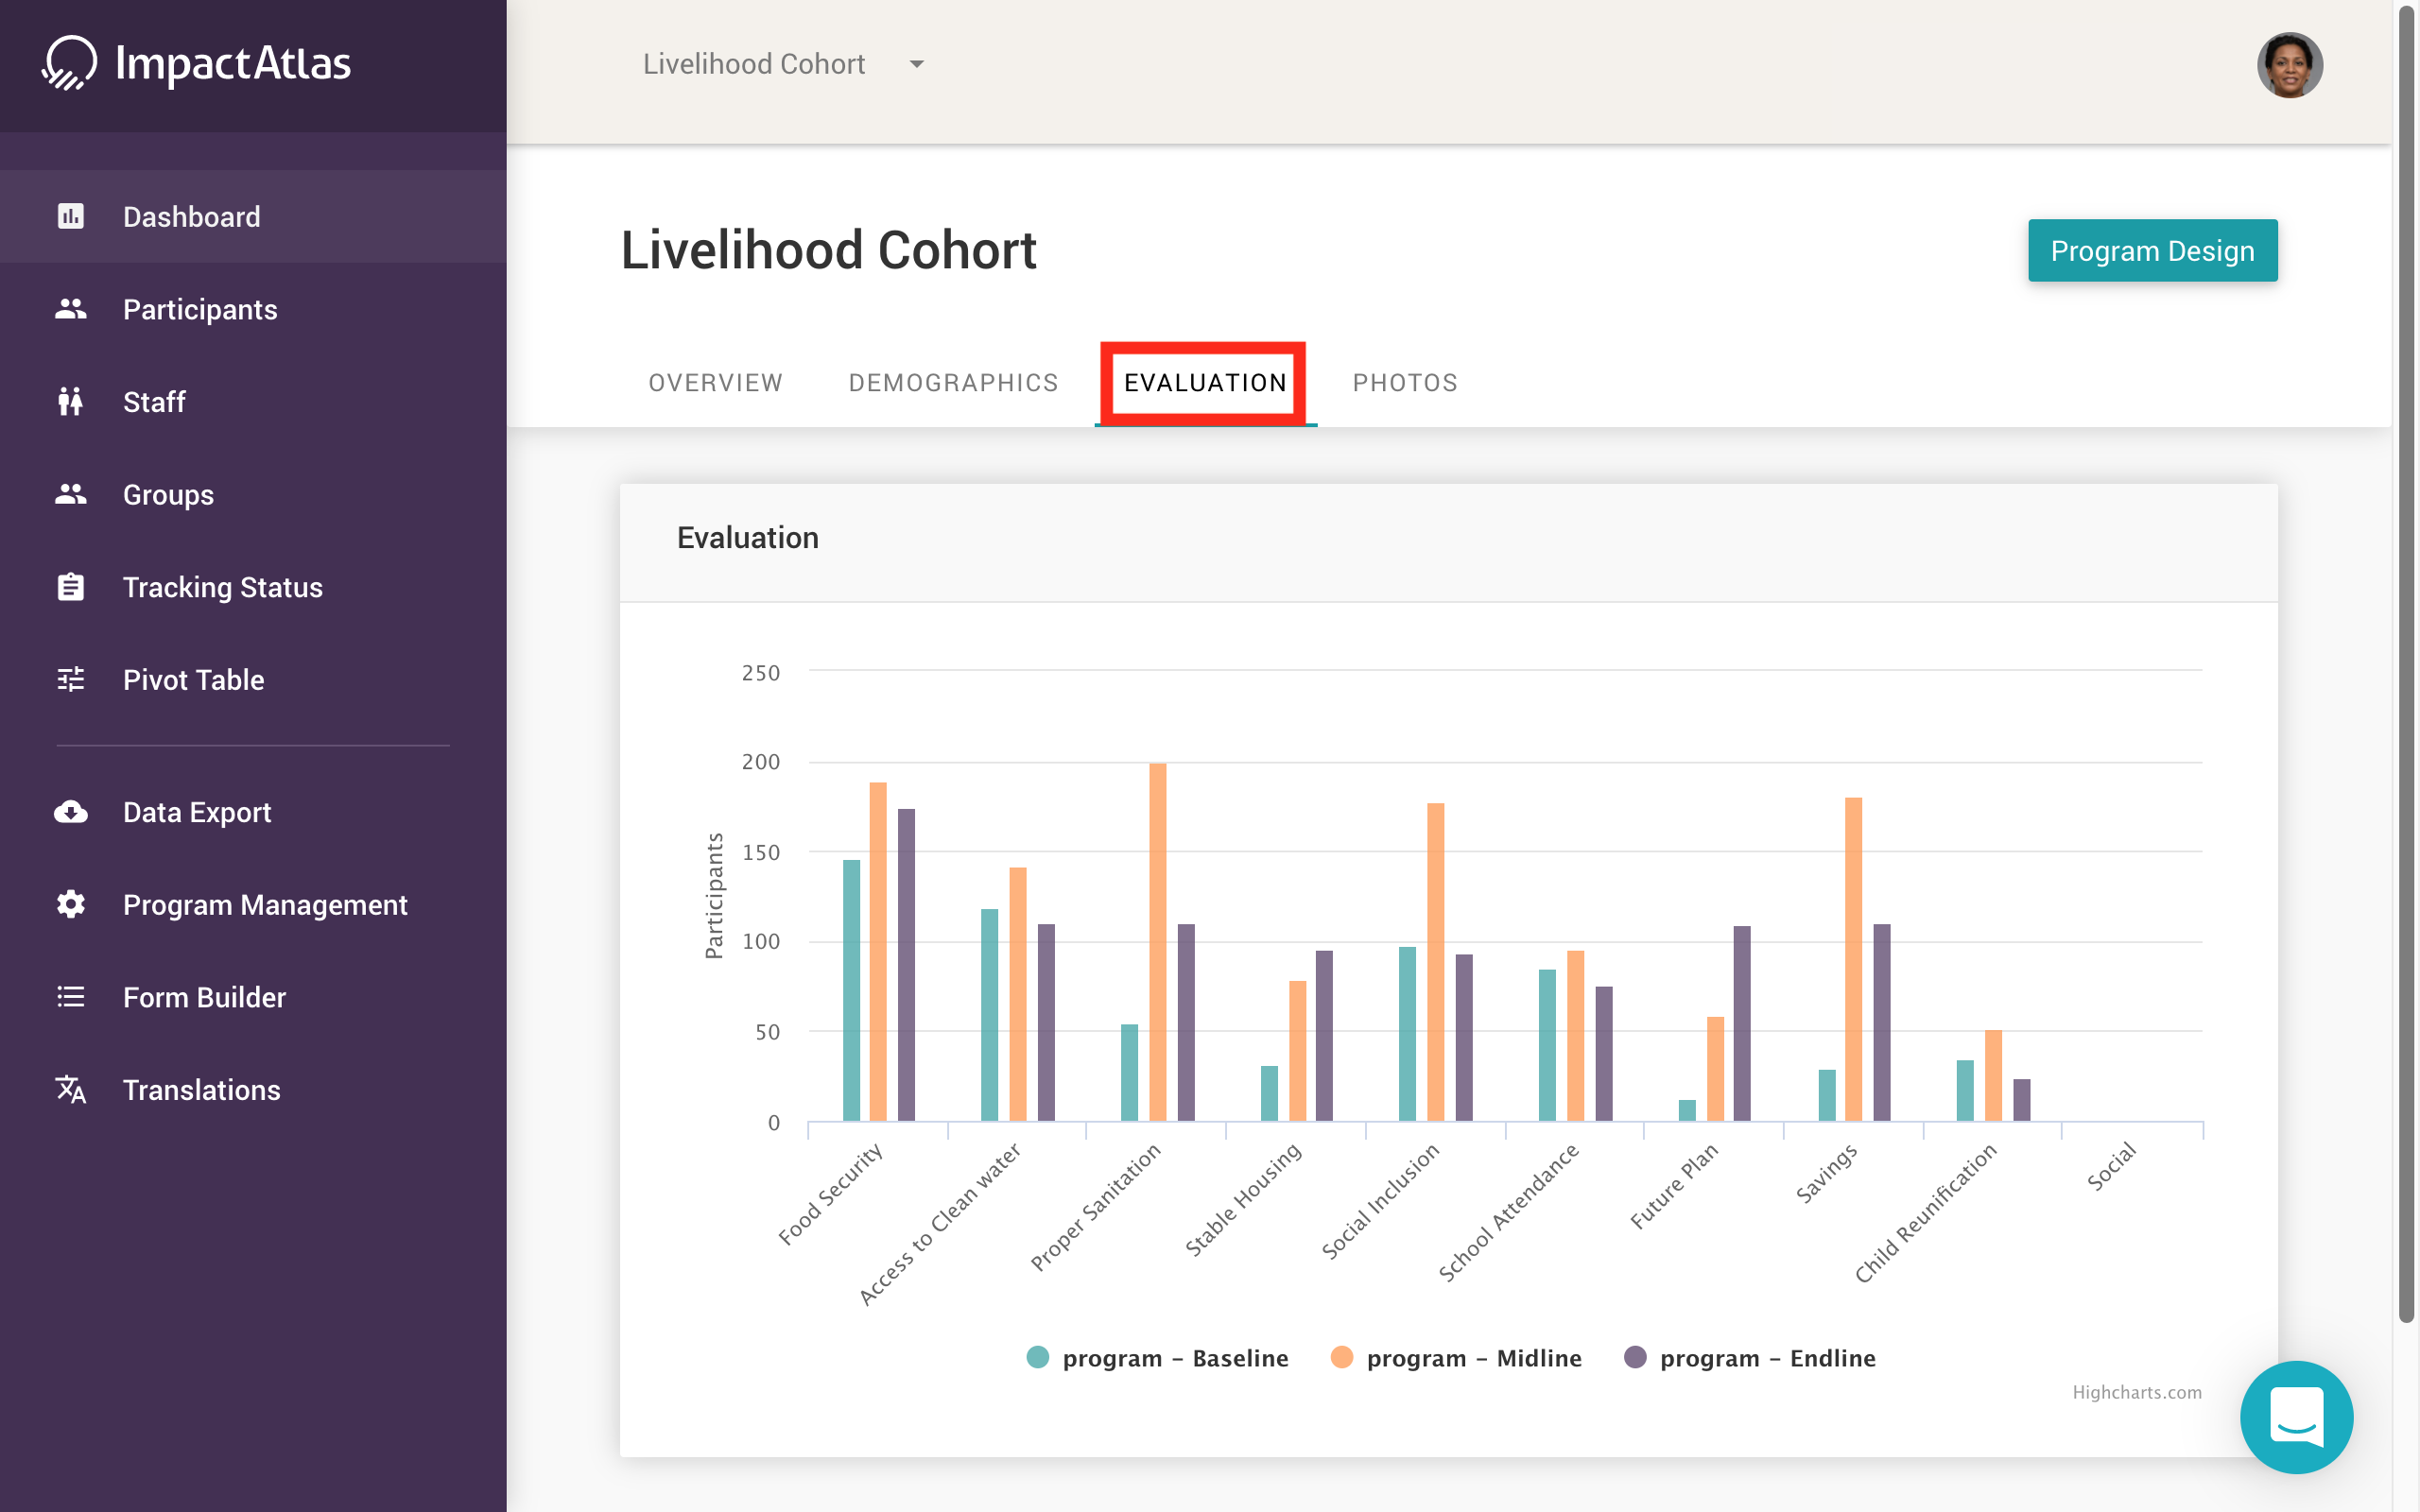.png)
As mentioned above with the tracking status display, the demographics, evaluation, and photos sections of the homepage will only display data that has been collected through surveys and trainings.