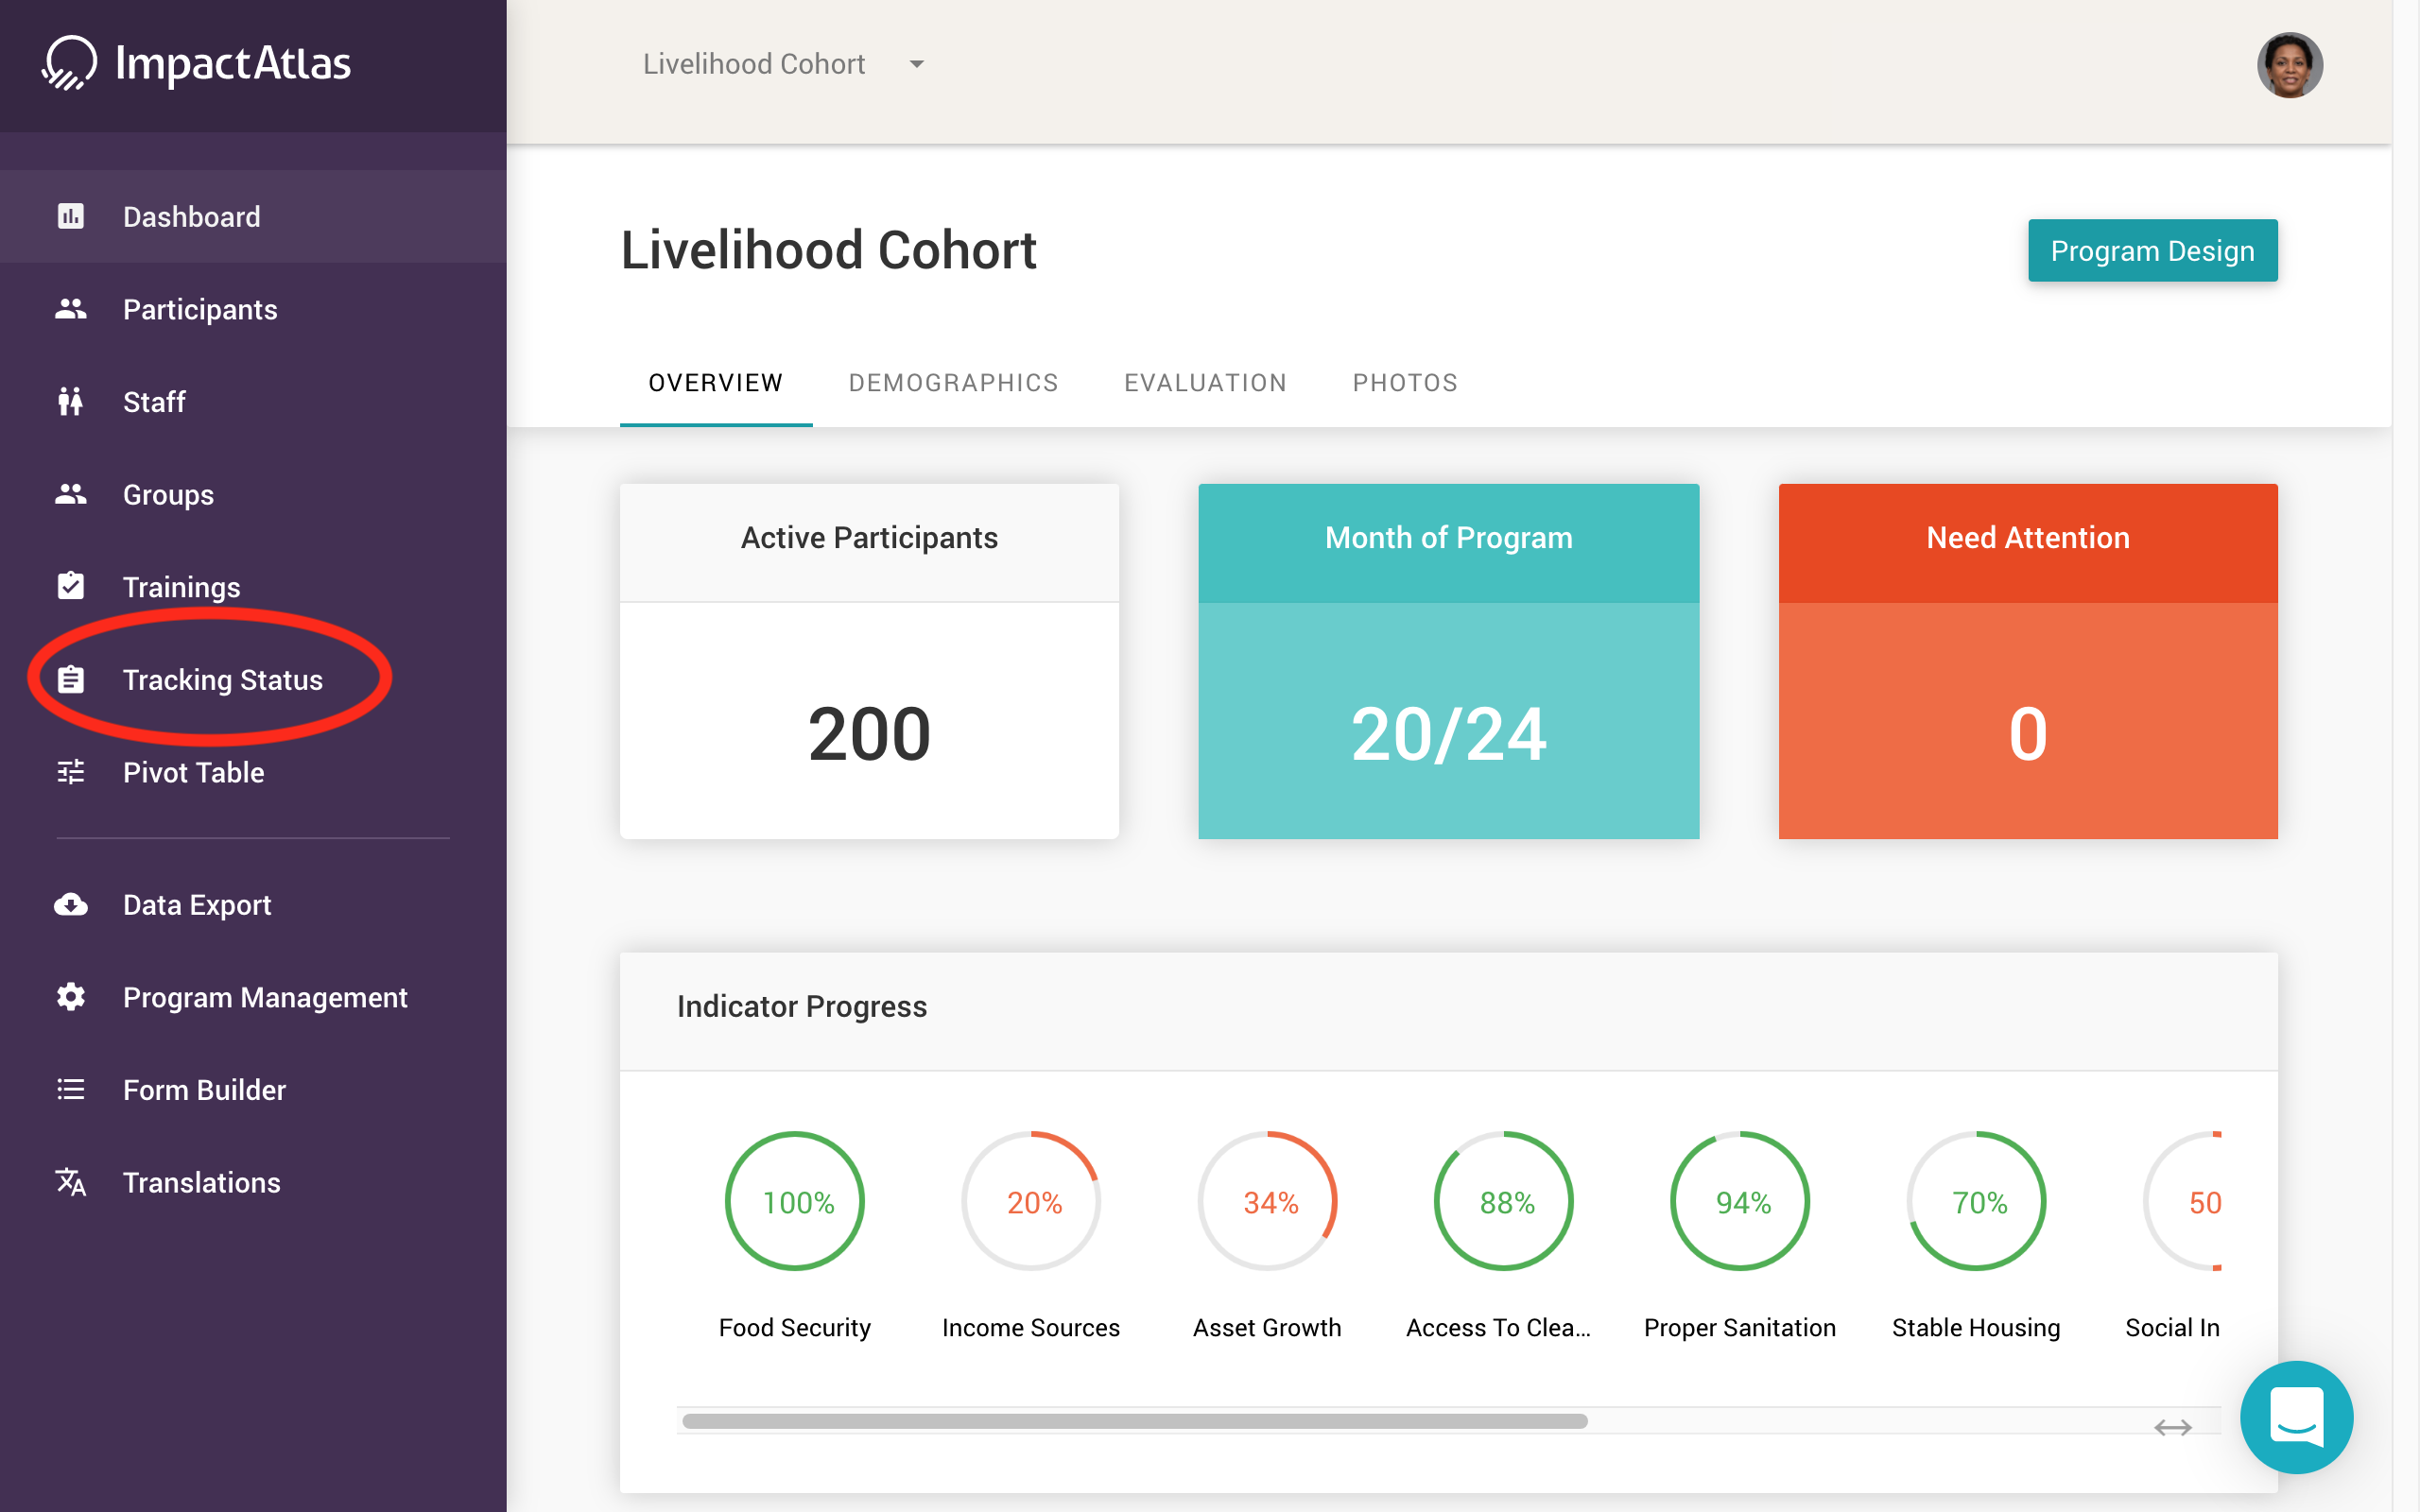
In the left navigation, select “Tracking Status”:
.png)
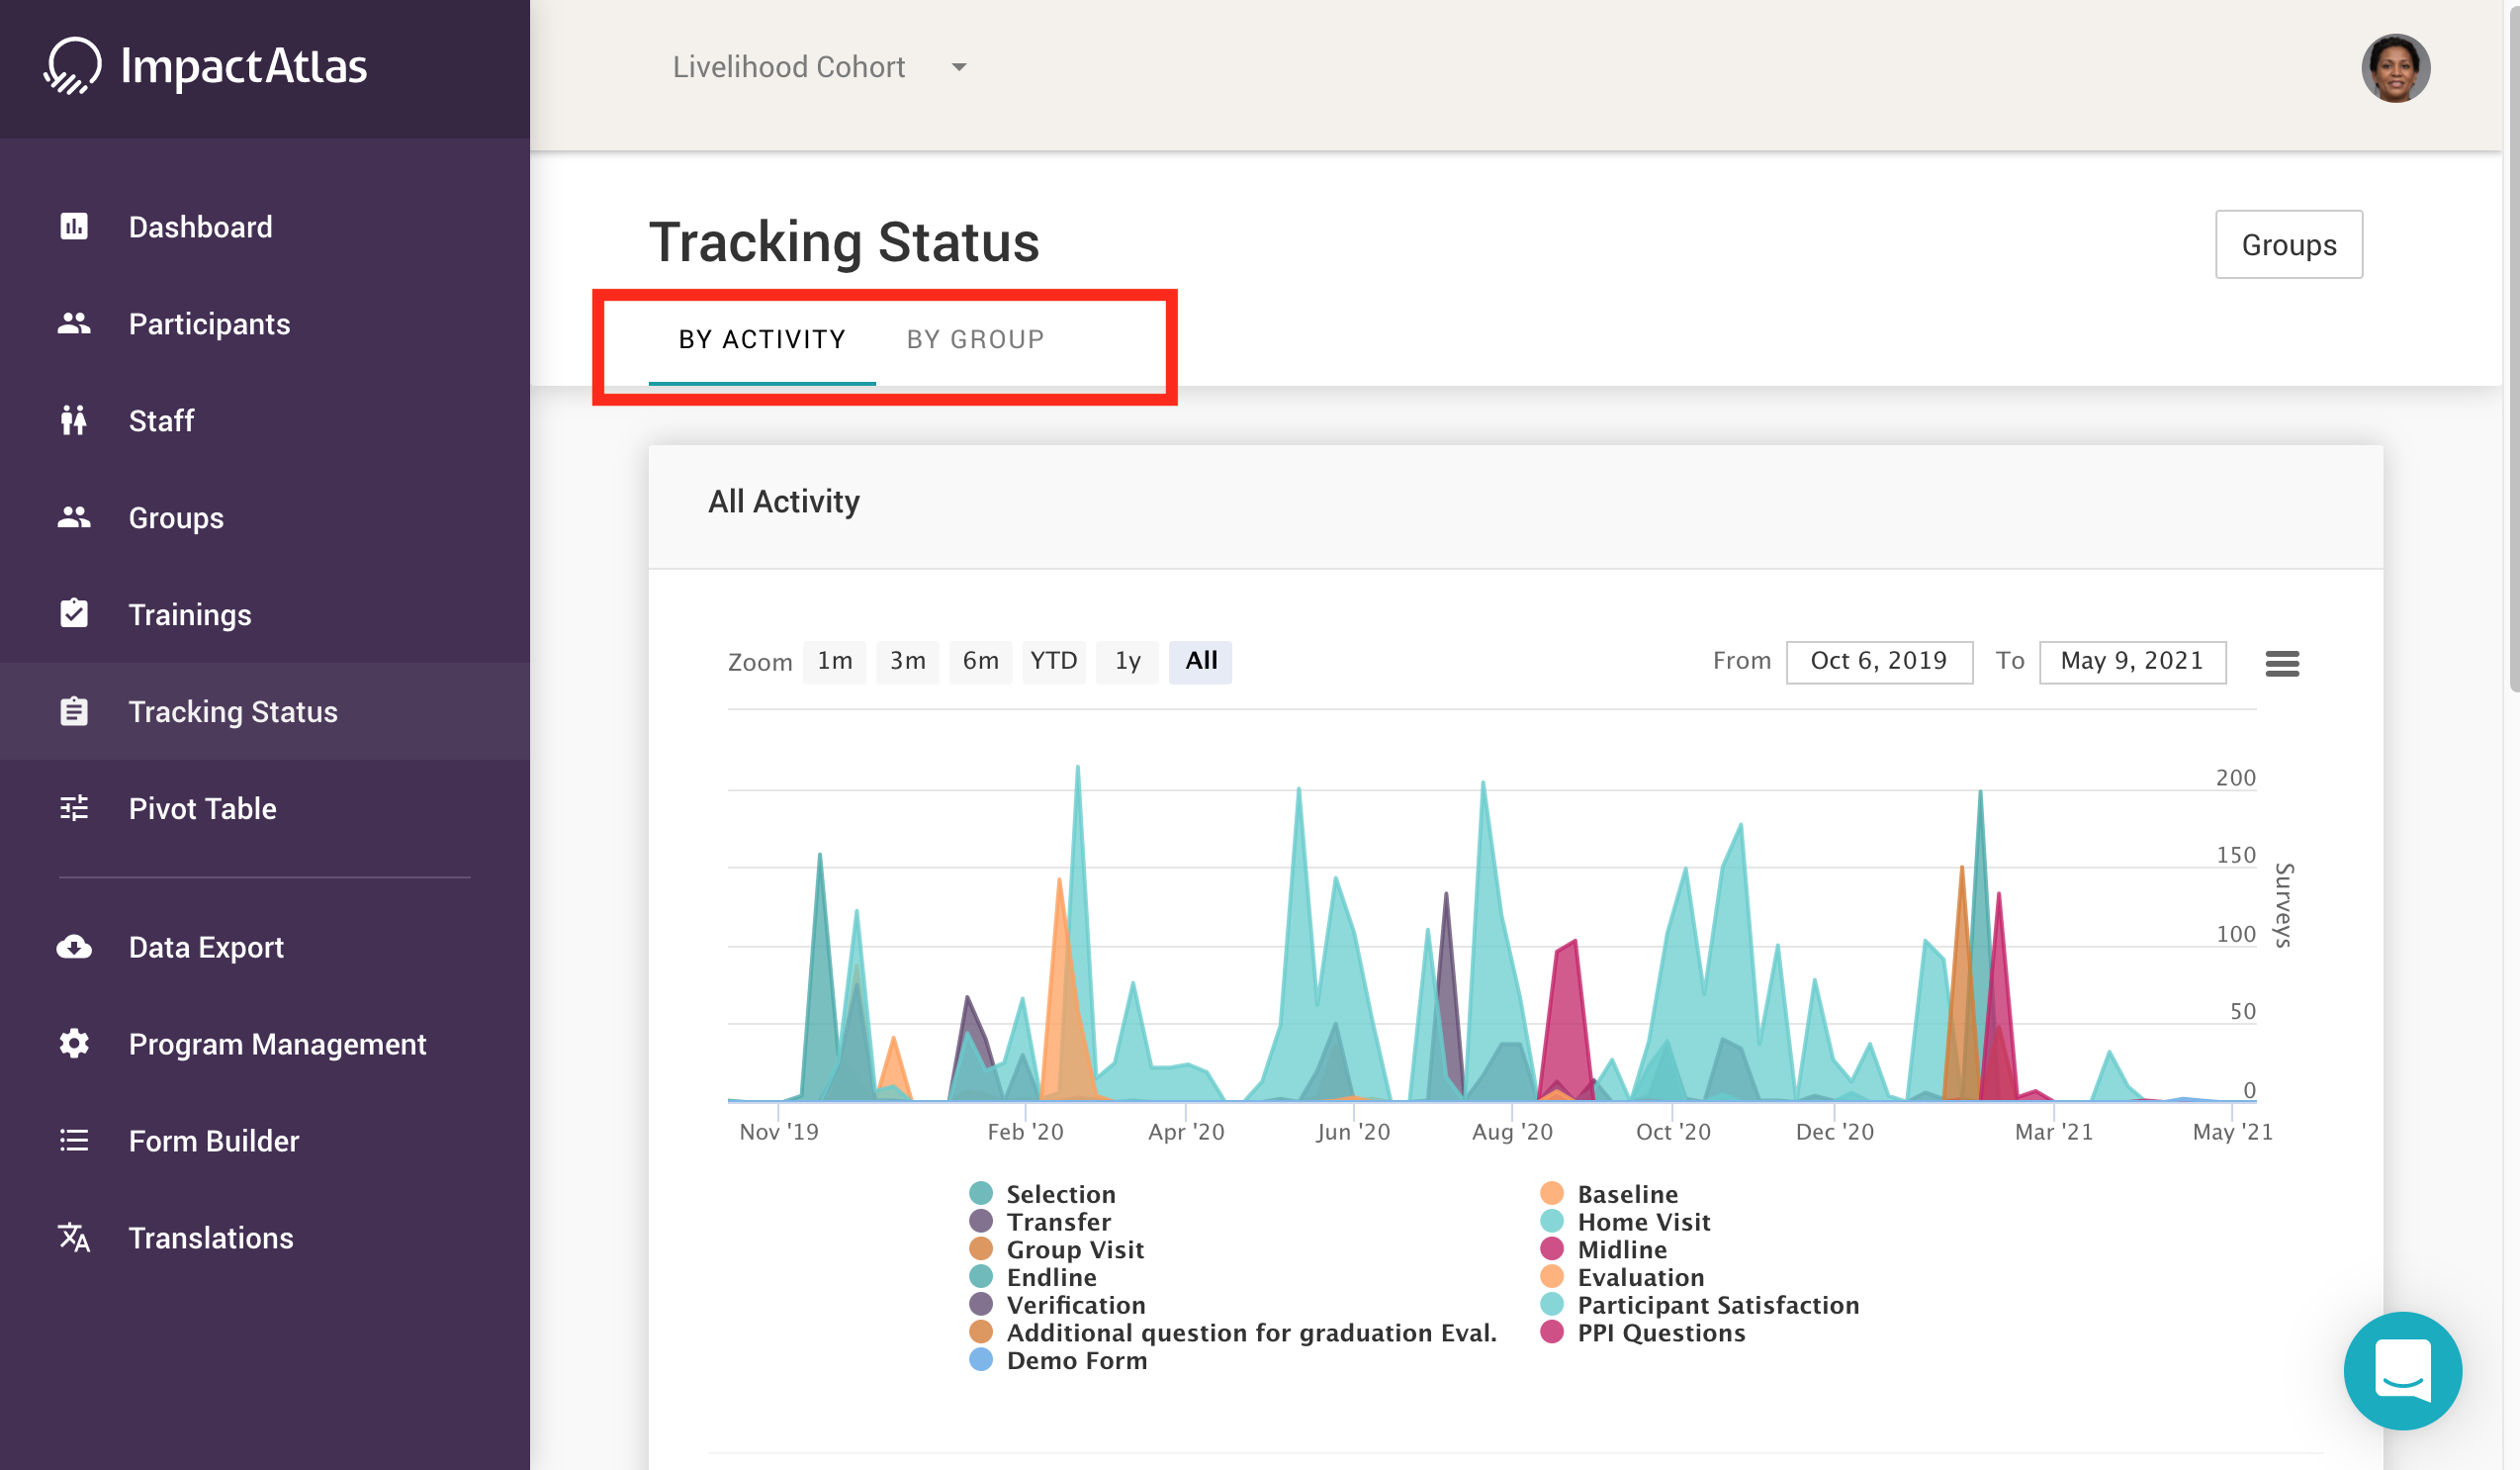
This page allows you to track the number of submissions made in total. You can visualize this data by activity timeline or by group using the tabs on top of the graph.
.png)
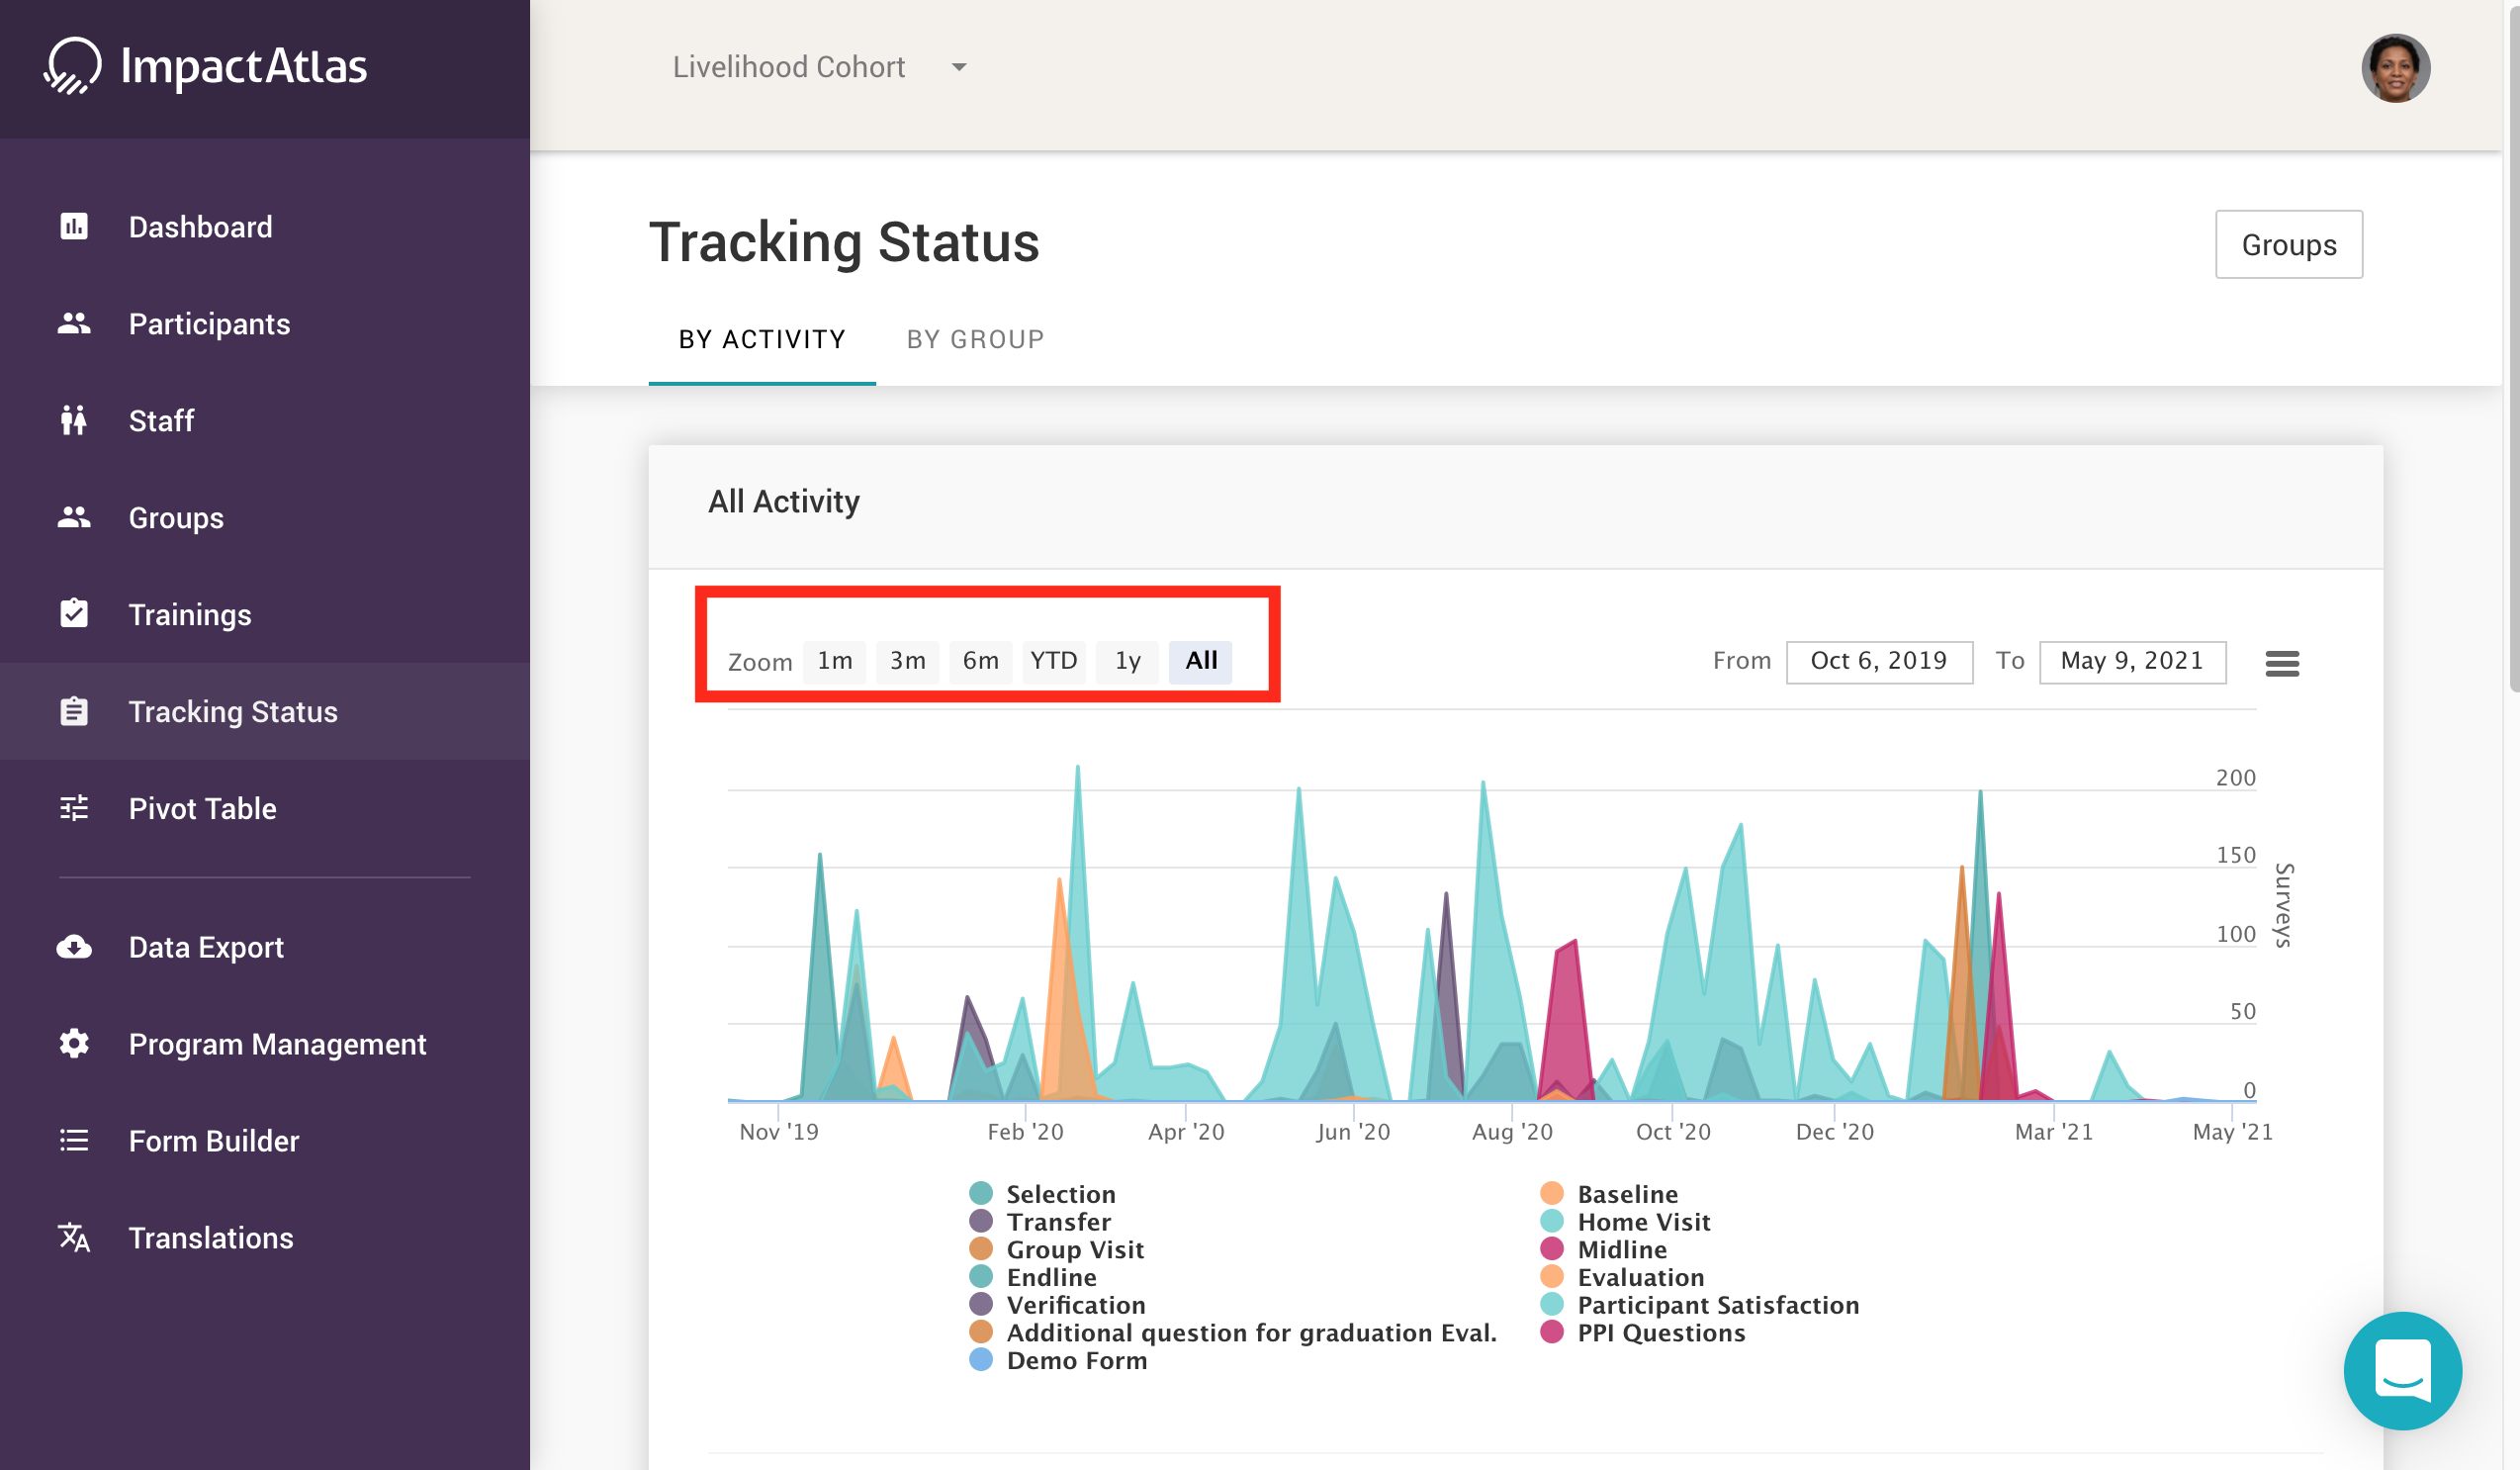
You can set time frame:
.png)
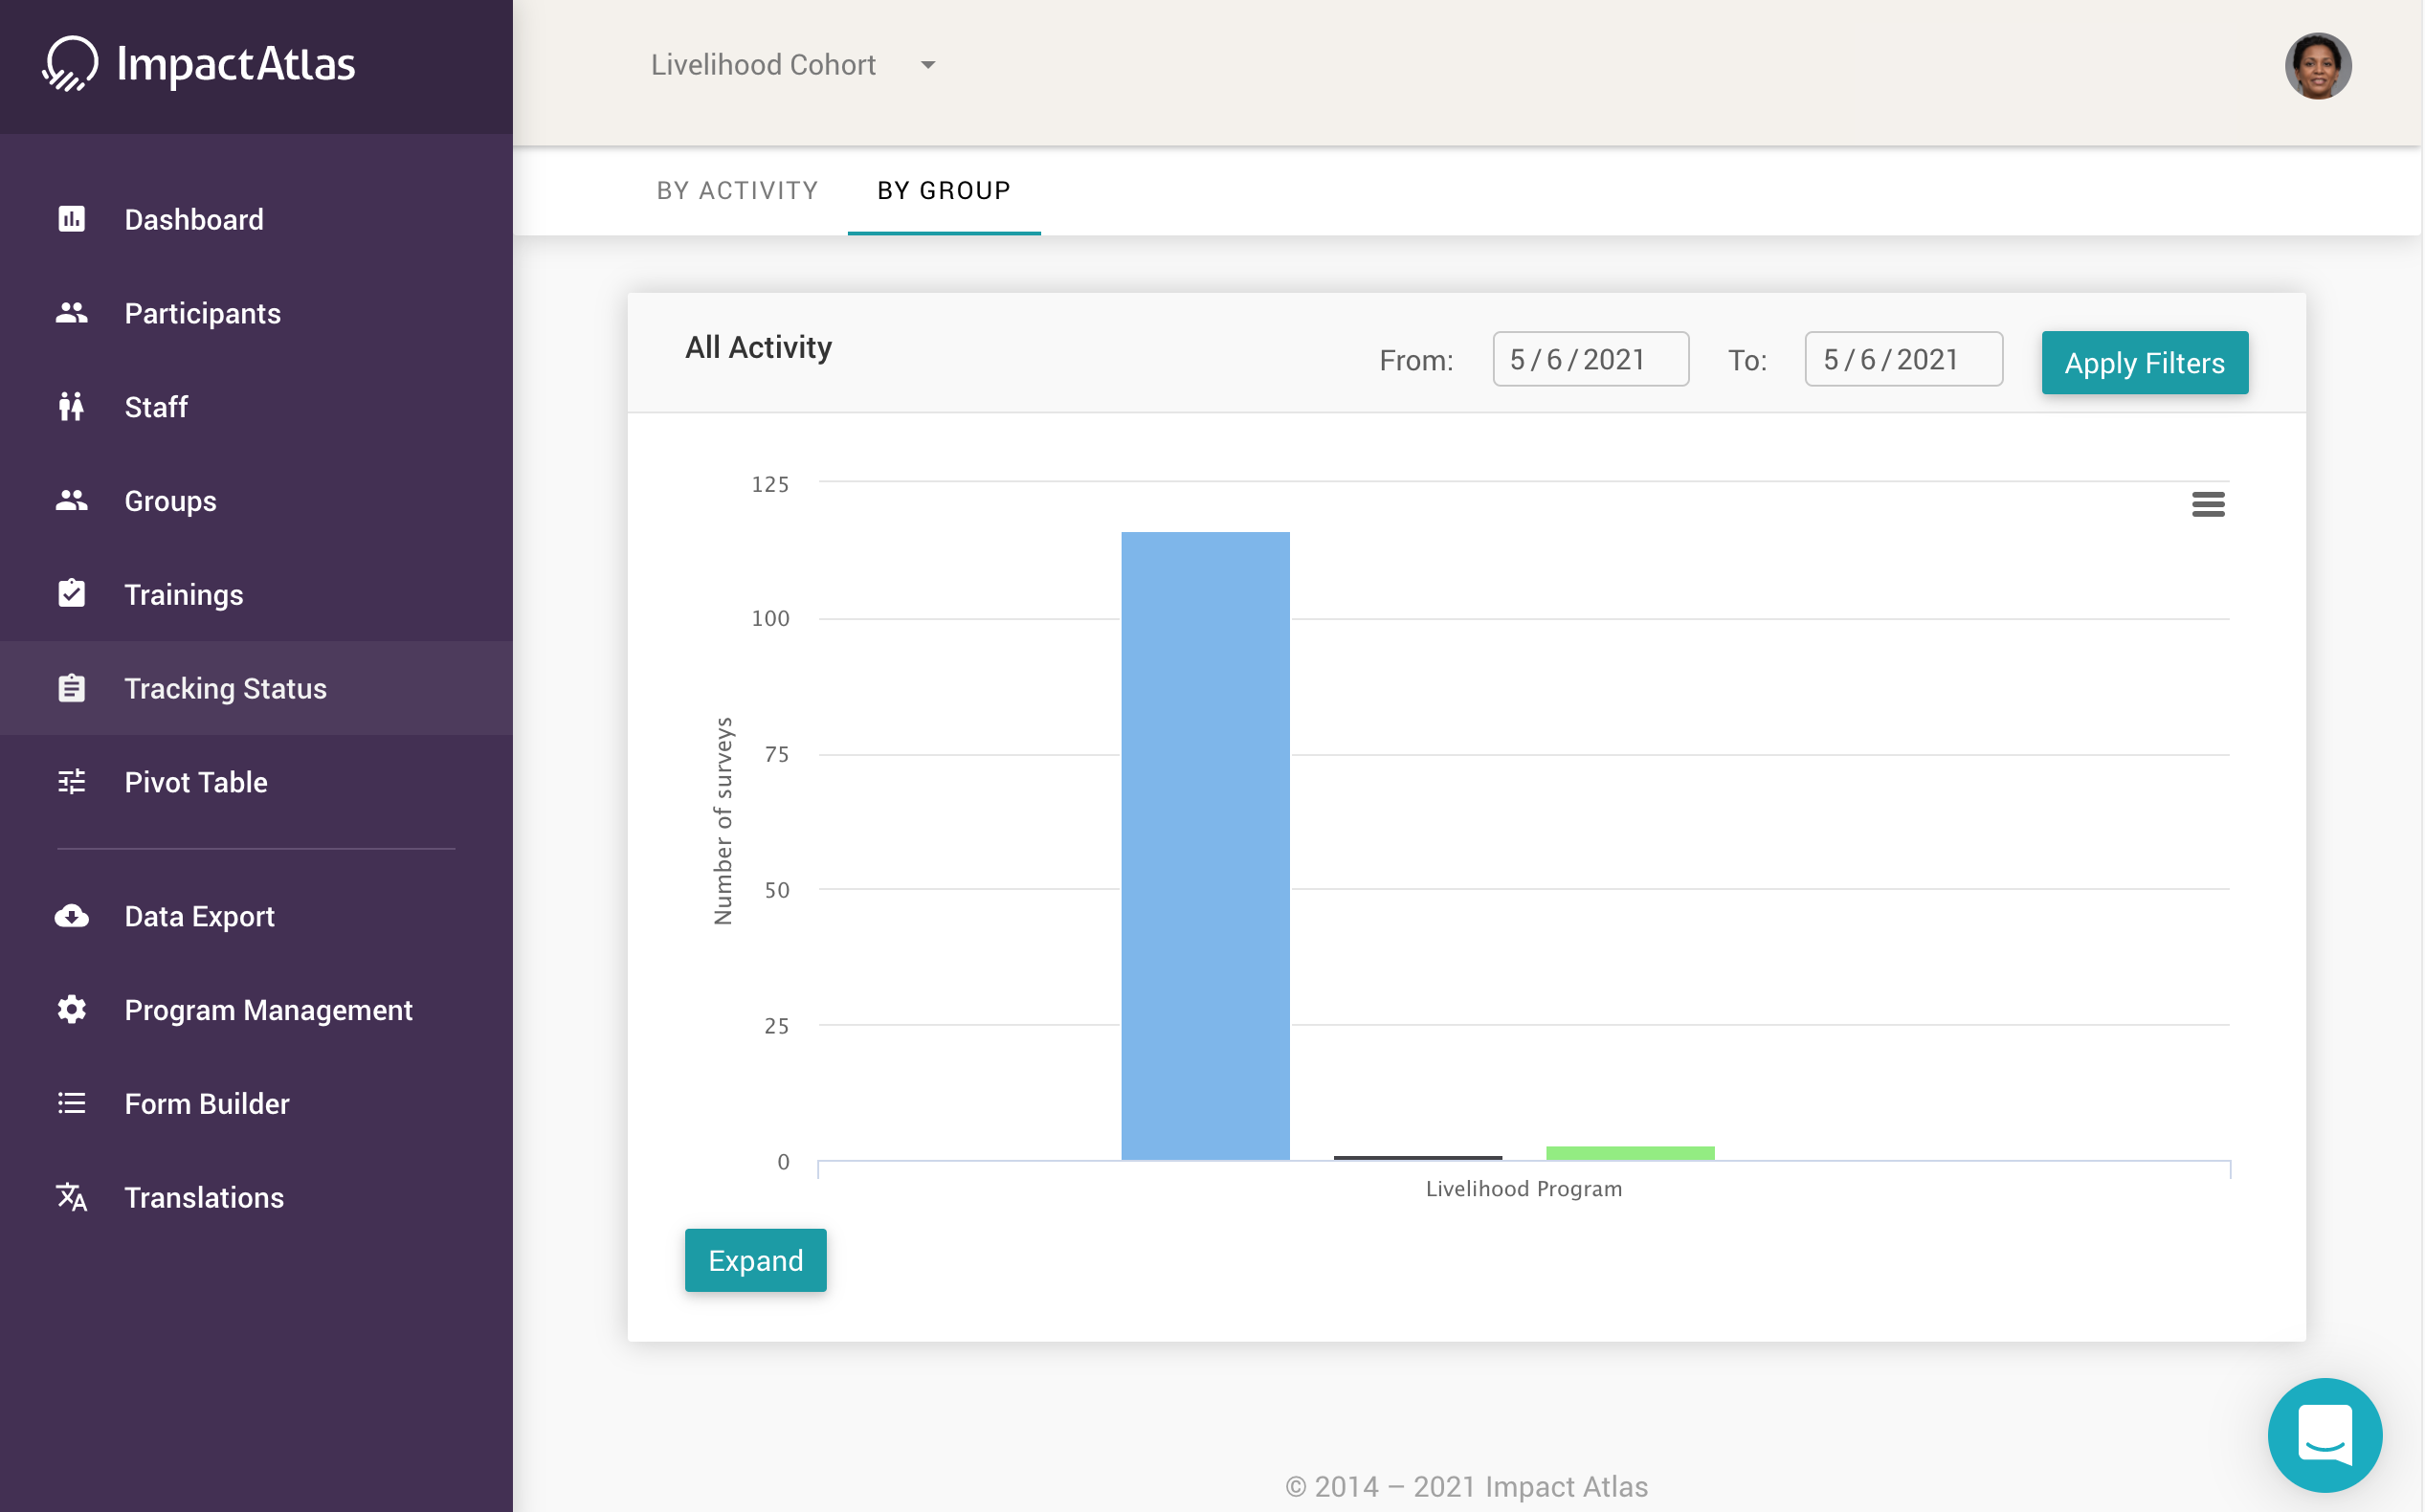
You can also search for a specific group:
.png)
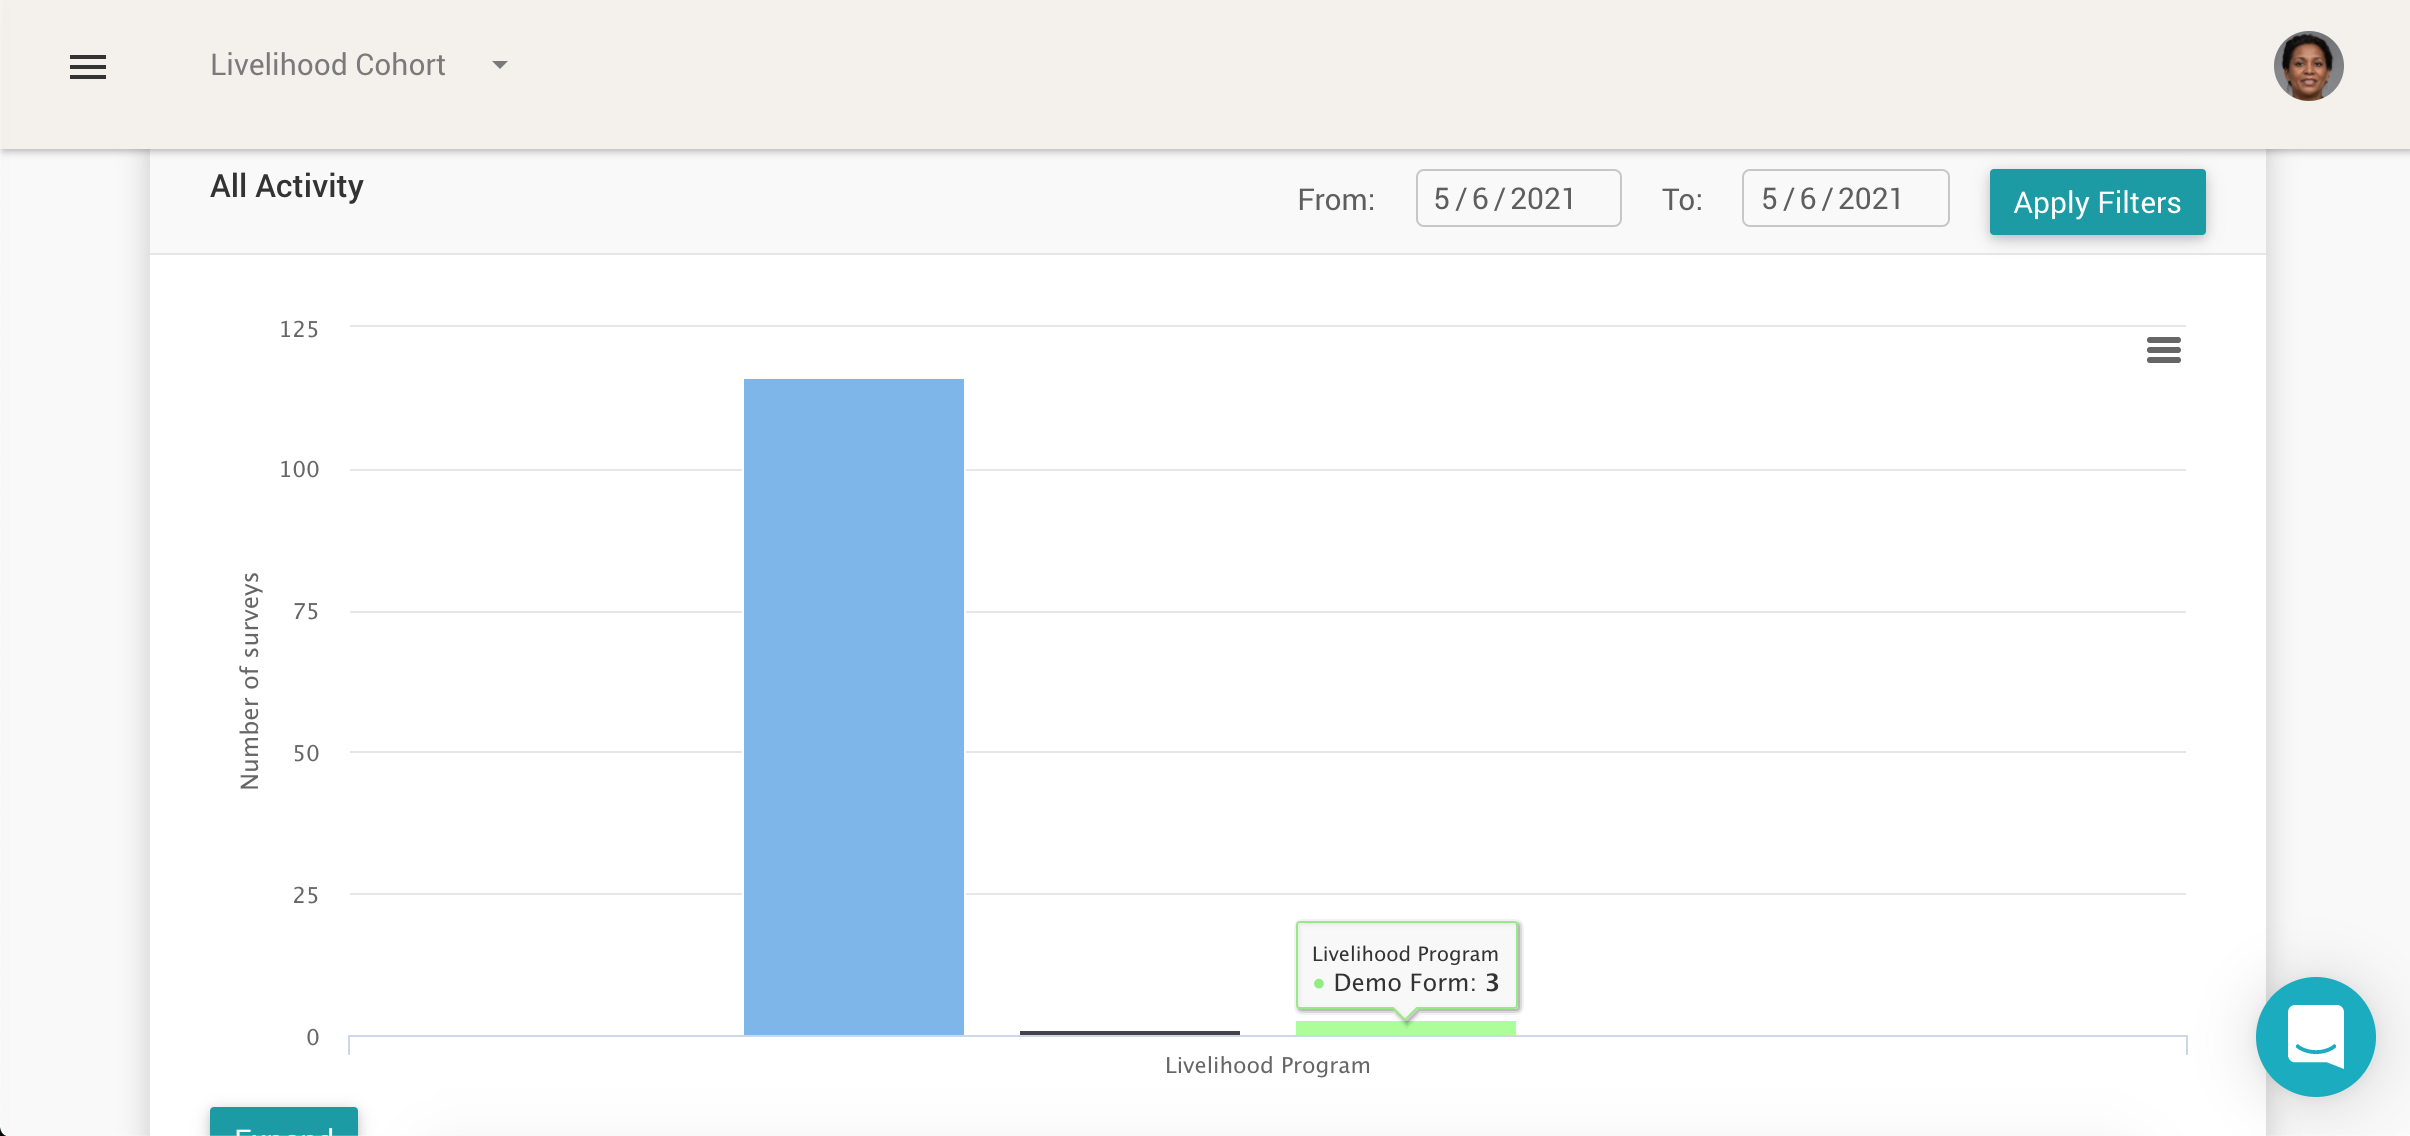
To toggle on and off the visualization of a certain phase in the graph, just click the on the different bars, for example, and you'll see the infographic window pop open.
.png)